Loading reviewed source data…
01 · FIEC country reports
New build vs renovation,
2022 to 2026
Europe’s construction market is no longer defined only by how much is built, but by how investment is divided between new capacity, renovation and infrastructure.
This interactive article brings together the Construction Activity tables in the FIEC 2025 country reports. It compares the reported 2025 investment mix, follows annual growth from 2022 to the 2026 forecast, and makes the underlying country values available for inspection and download.
The distinction matters for work on existing buildings, but it must be read carefully. FIEC reports housing renovation separately, while non-residential construction includes repair and maintenance without splitting new from existing work. The figures describe investment value, not the number or floor area of structures.
Why existing buildings matter for climate and energy. The investment figures here say nothing about emissions, but the policy context explains why the split between new build and renovation matters. The European Commission’s Renovation Wave Strategy (2020) states that buildings account for about 40% of EU energy consumption and 36% of energy-related greenhouse gas emissions. It also estimates that 85–95% of today’s buildings will still be standing in 2050, while only about 1% undergo energy-efficient renovation each year. Cutting building emissions and energy use therefore depends heavily on upgrading the existing stock. Whether renovation investment, as measured by FIEC, translates into energy savings and lower CO₂ depends on what the work actually does, and the data used here cannot show that.
Source: European Commission, “Renovation Wave: doubling the renovation rate to cut emissions, boost recovery and reduce energy poverty”, press release, 14 October 2020. https://www.eeas.europa.eu/eeas/renovation-wave-doubling-renovation-rate-cut-emissions-boost-recovery-and-reduce-energy-poverty_en
What the reported data suggests
Limits. “Renovation” here is housing only; non-residential includes repair and maintenance and is not split into new vs existing; definitions and price bases differ by country; FIEC figures are estimates and forecasts for 2025 and 2026; this is investment value, not share of work by structure type.
02 · national case study
Case of Kosova
A growing housing stock, high vacancy and uneven occupancy make Kosova’s renovation challenge fundamentally different from a simple count of buildings.
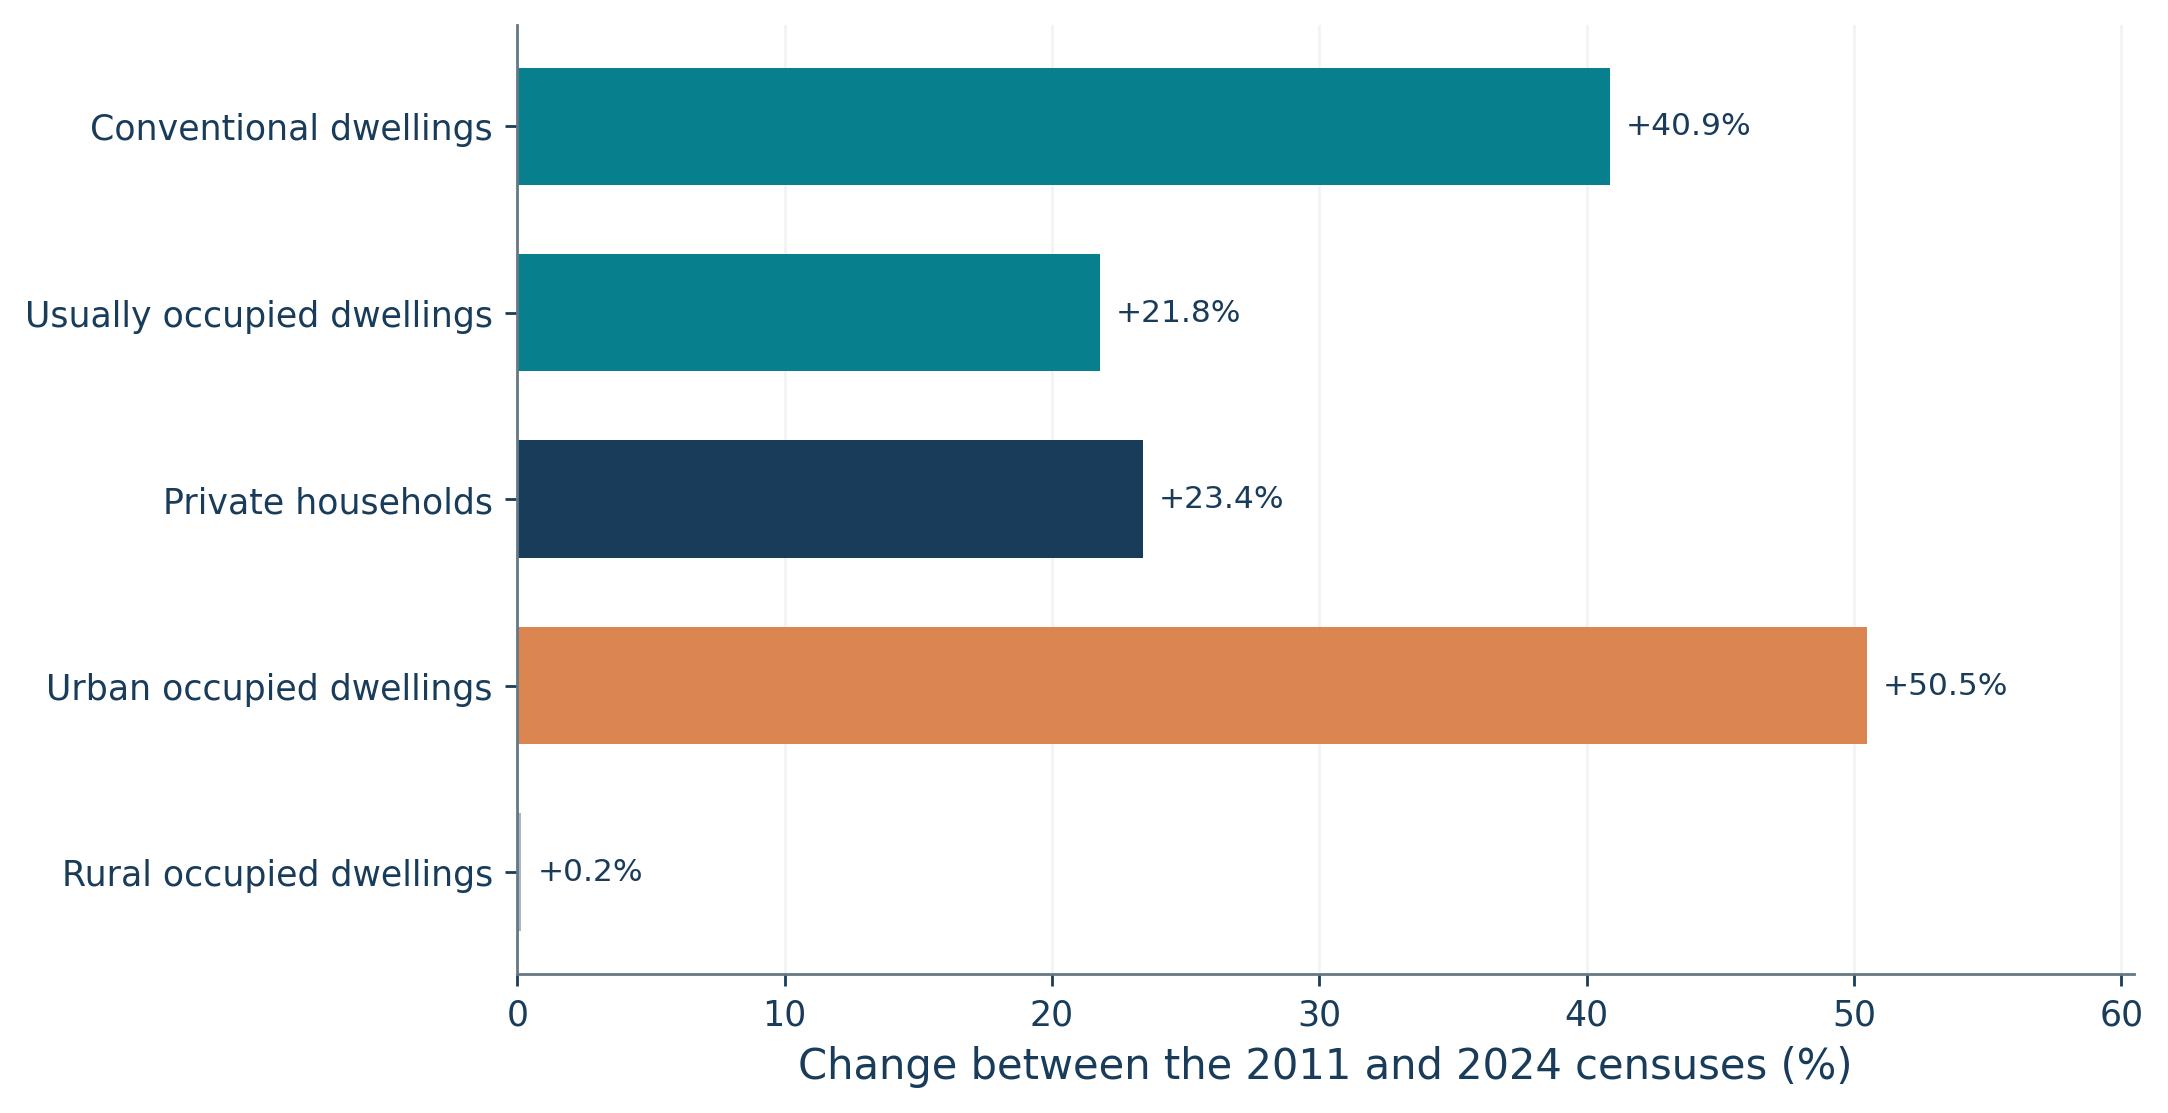
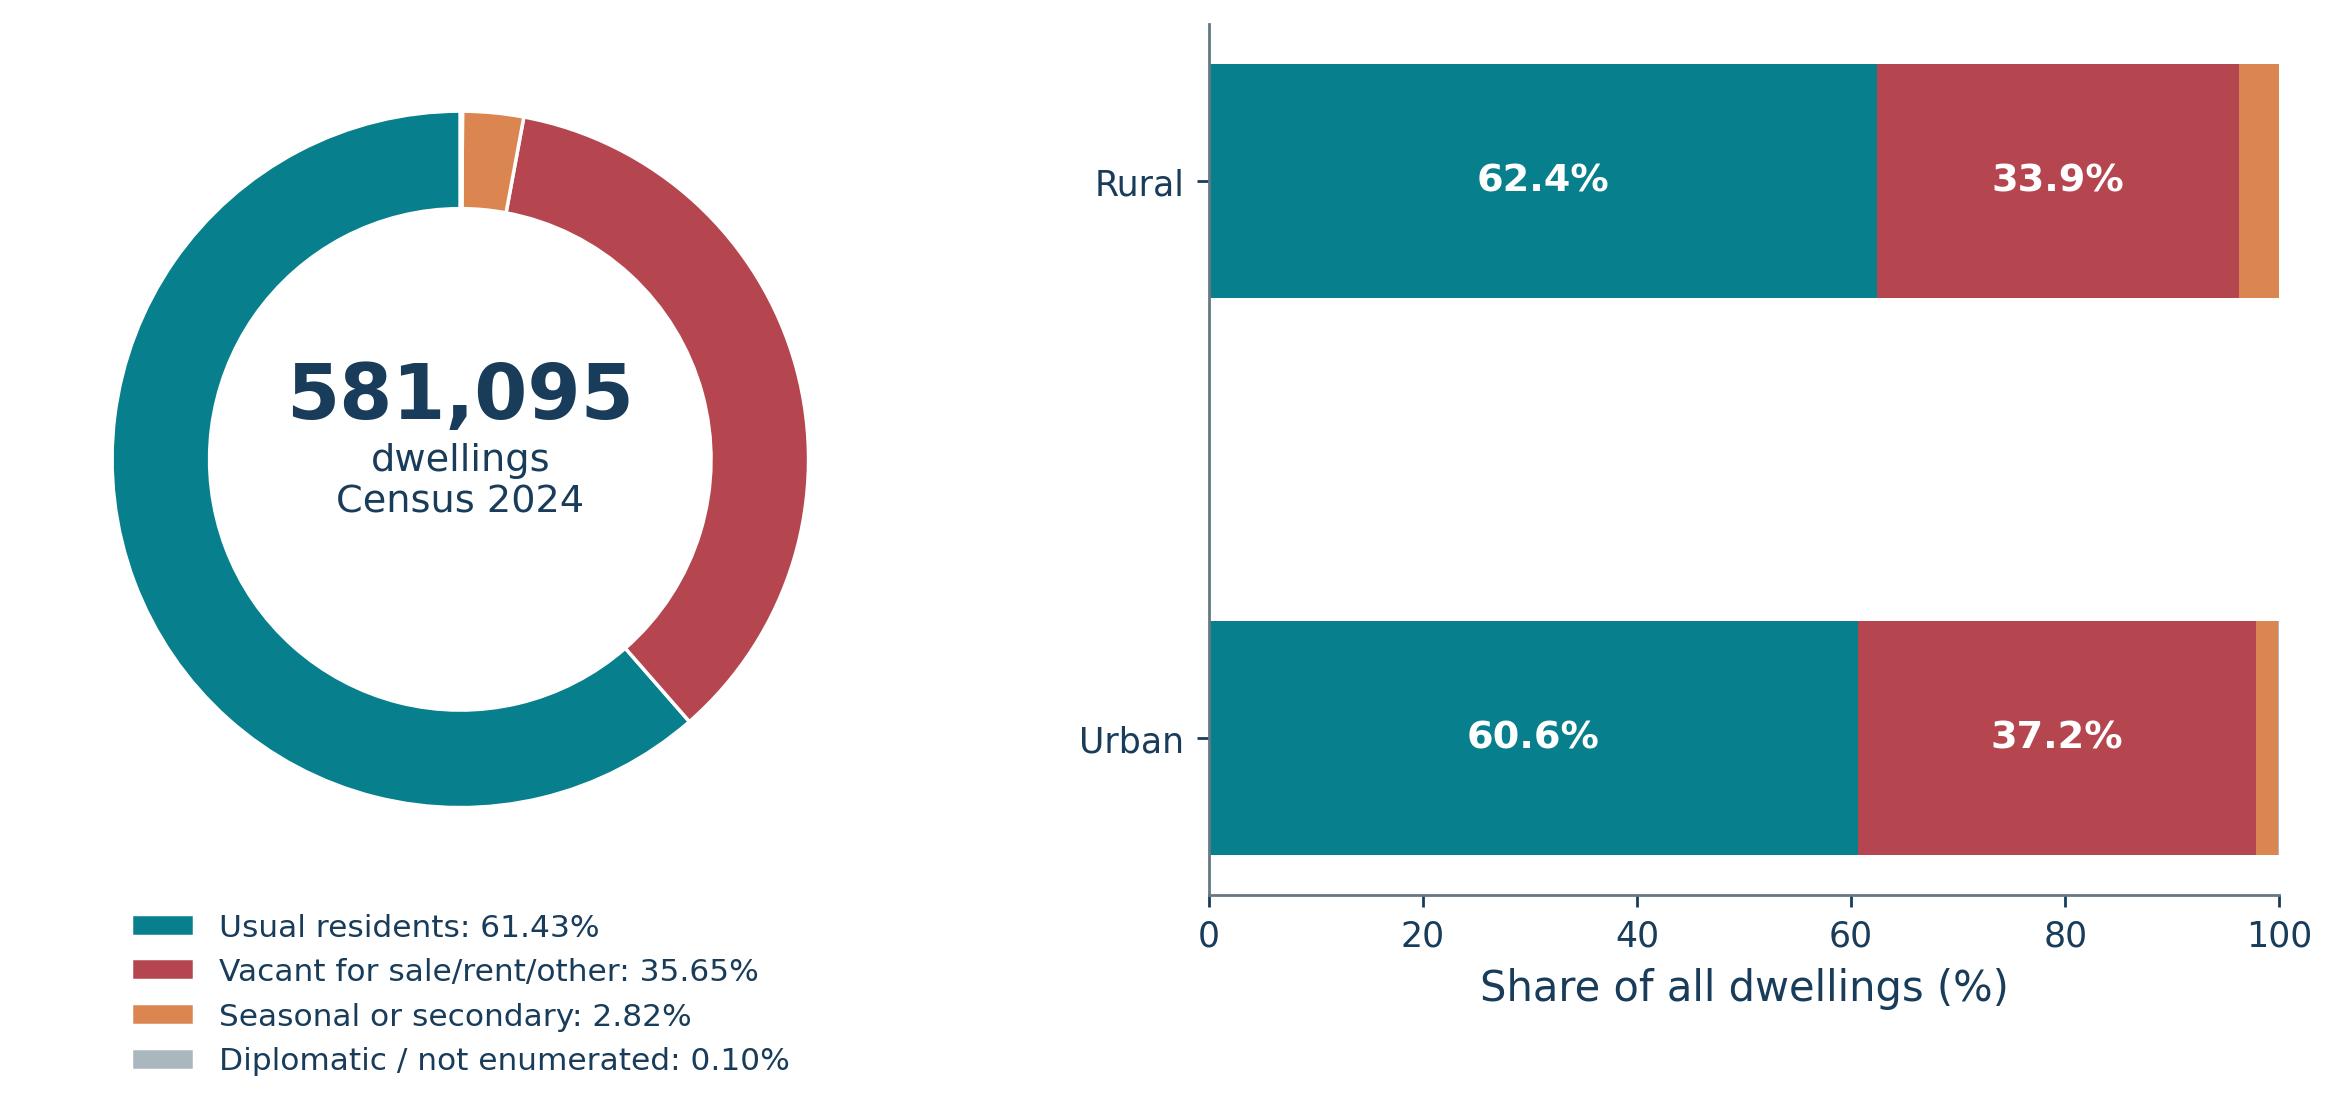
The 2024 census records 581,095 dwellings, of which 356,959 were occupied by usual residents and 207,165 were vacant. Between 2011 and 2024, the conventional dwelling stock increased by 40.9%, while occupied dwellings increased by 21.8%. The change was spatially uneven: occupied urban dwellings rose by 50.5%, while the rural endpoint was almost unchanged.
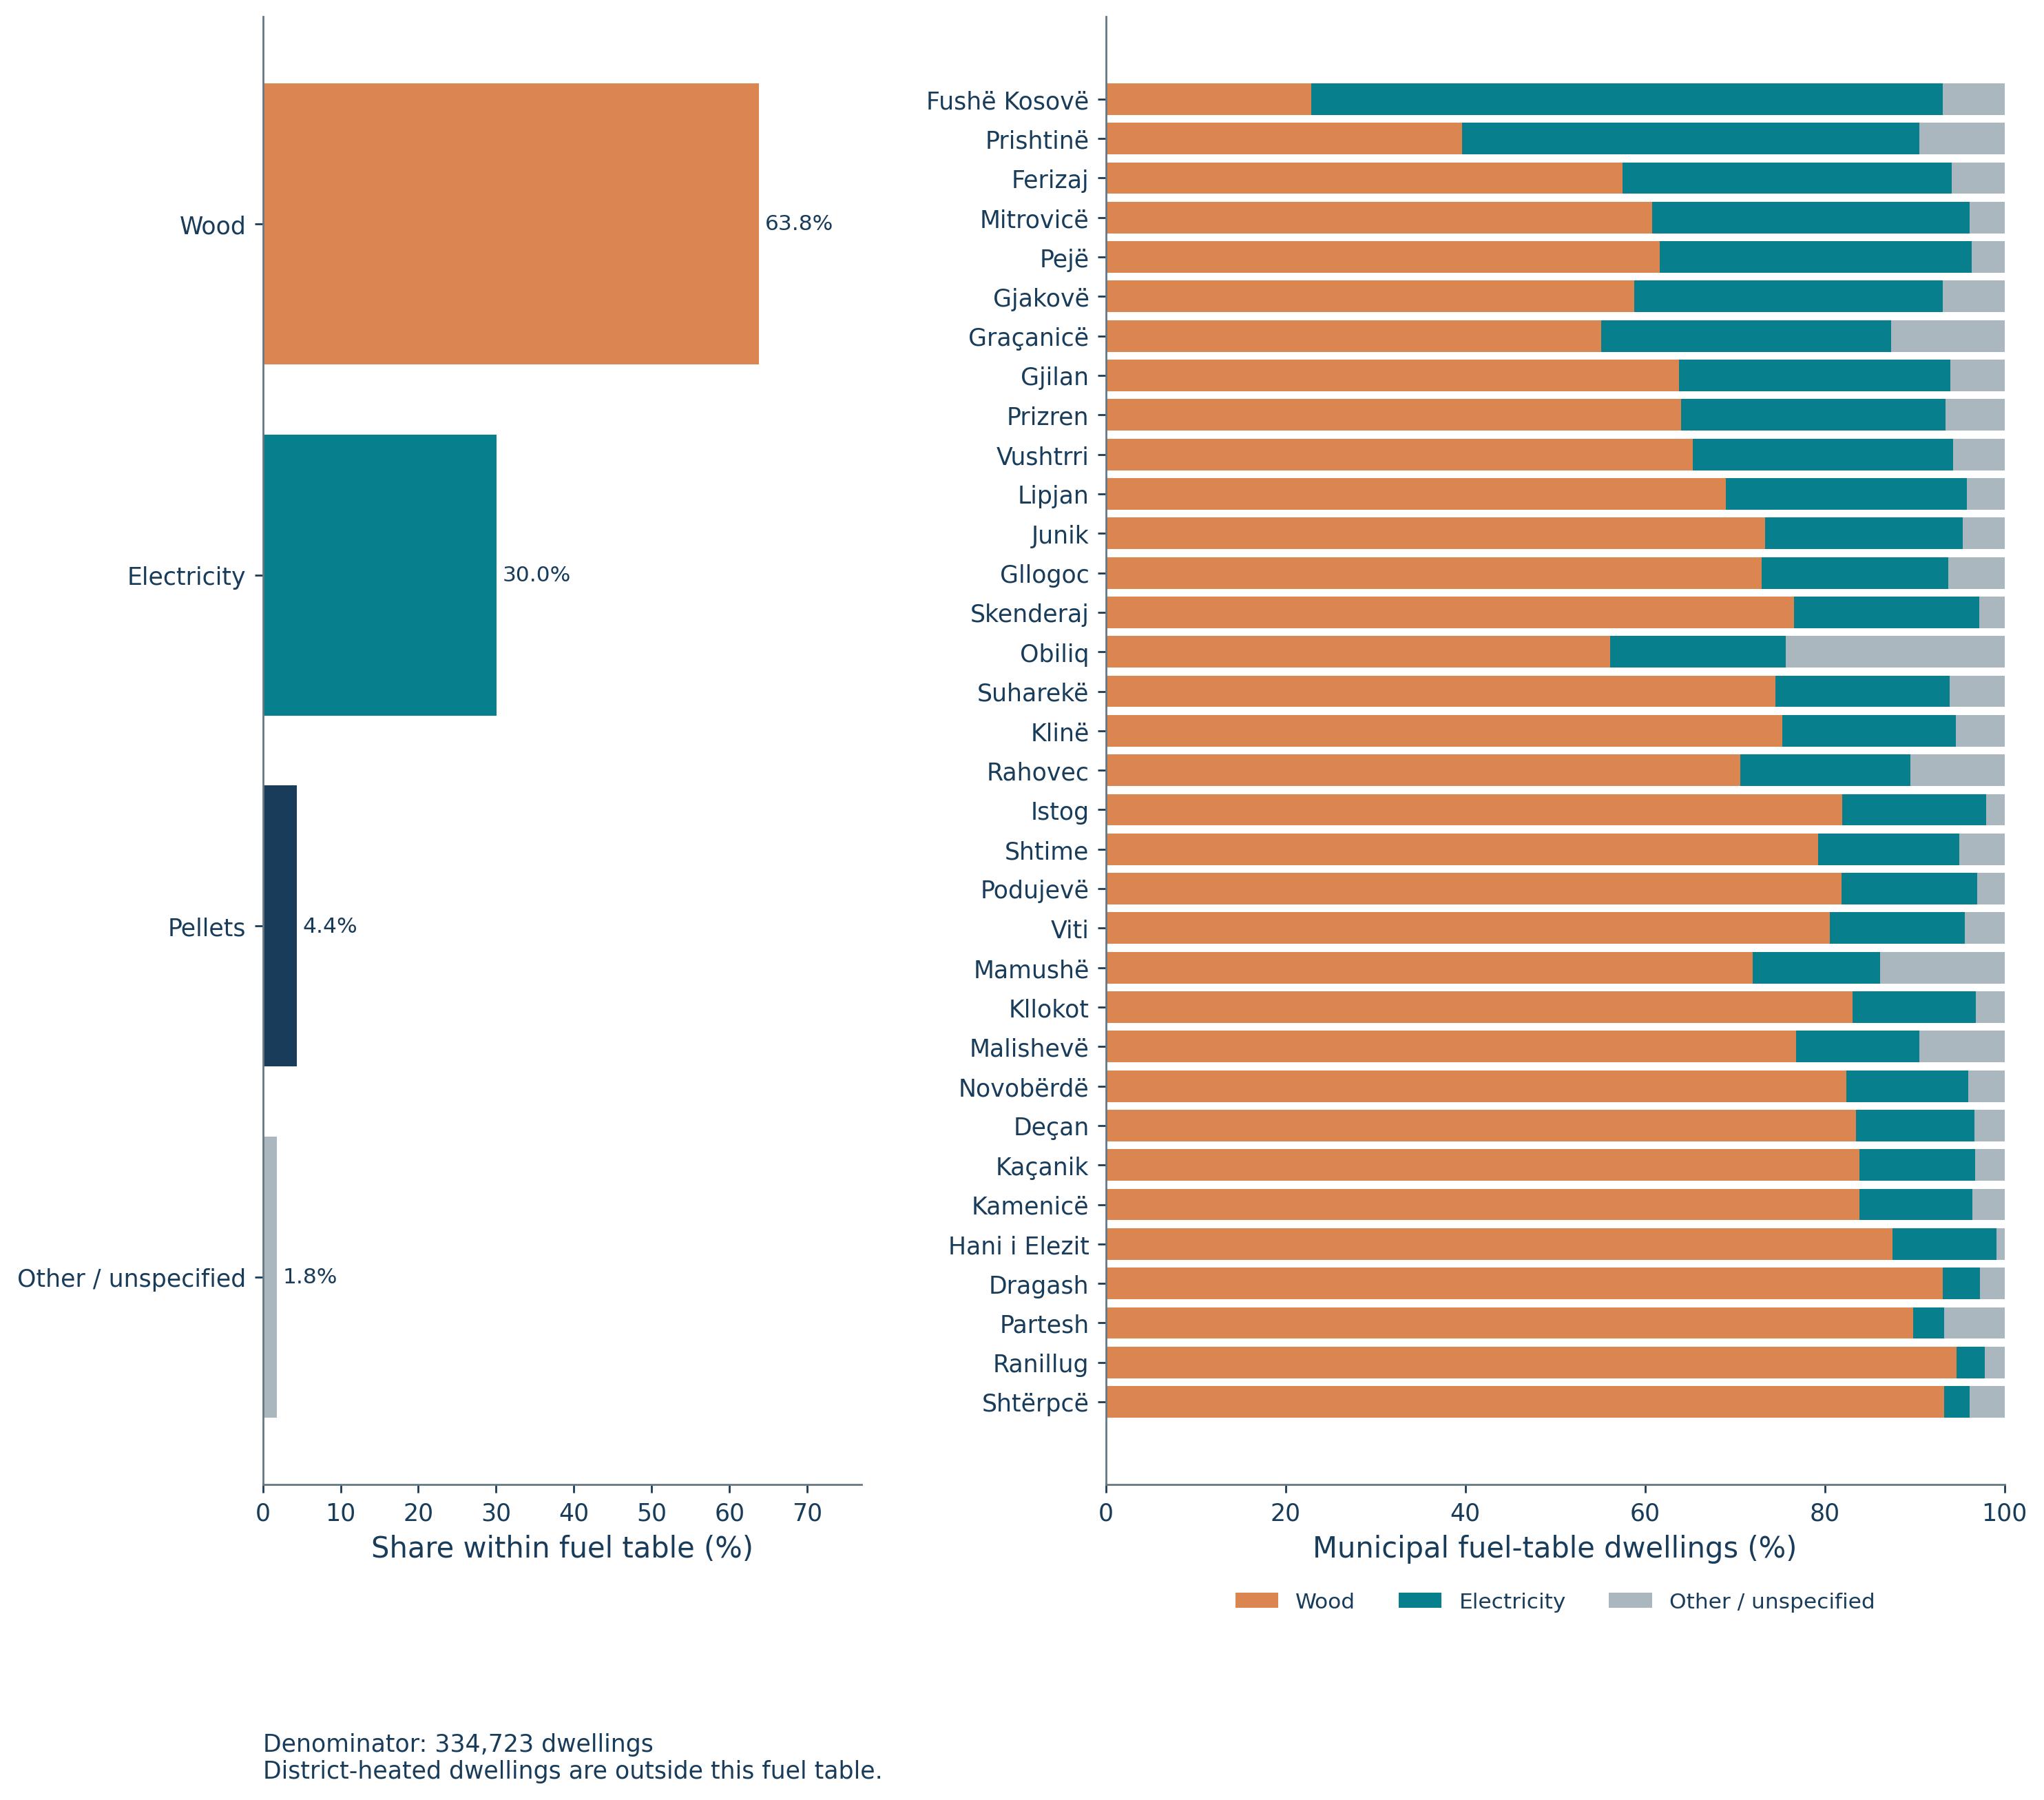
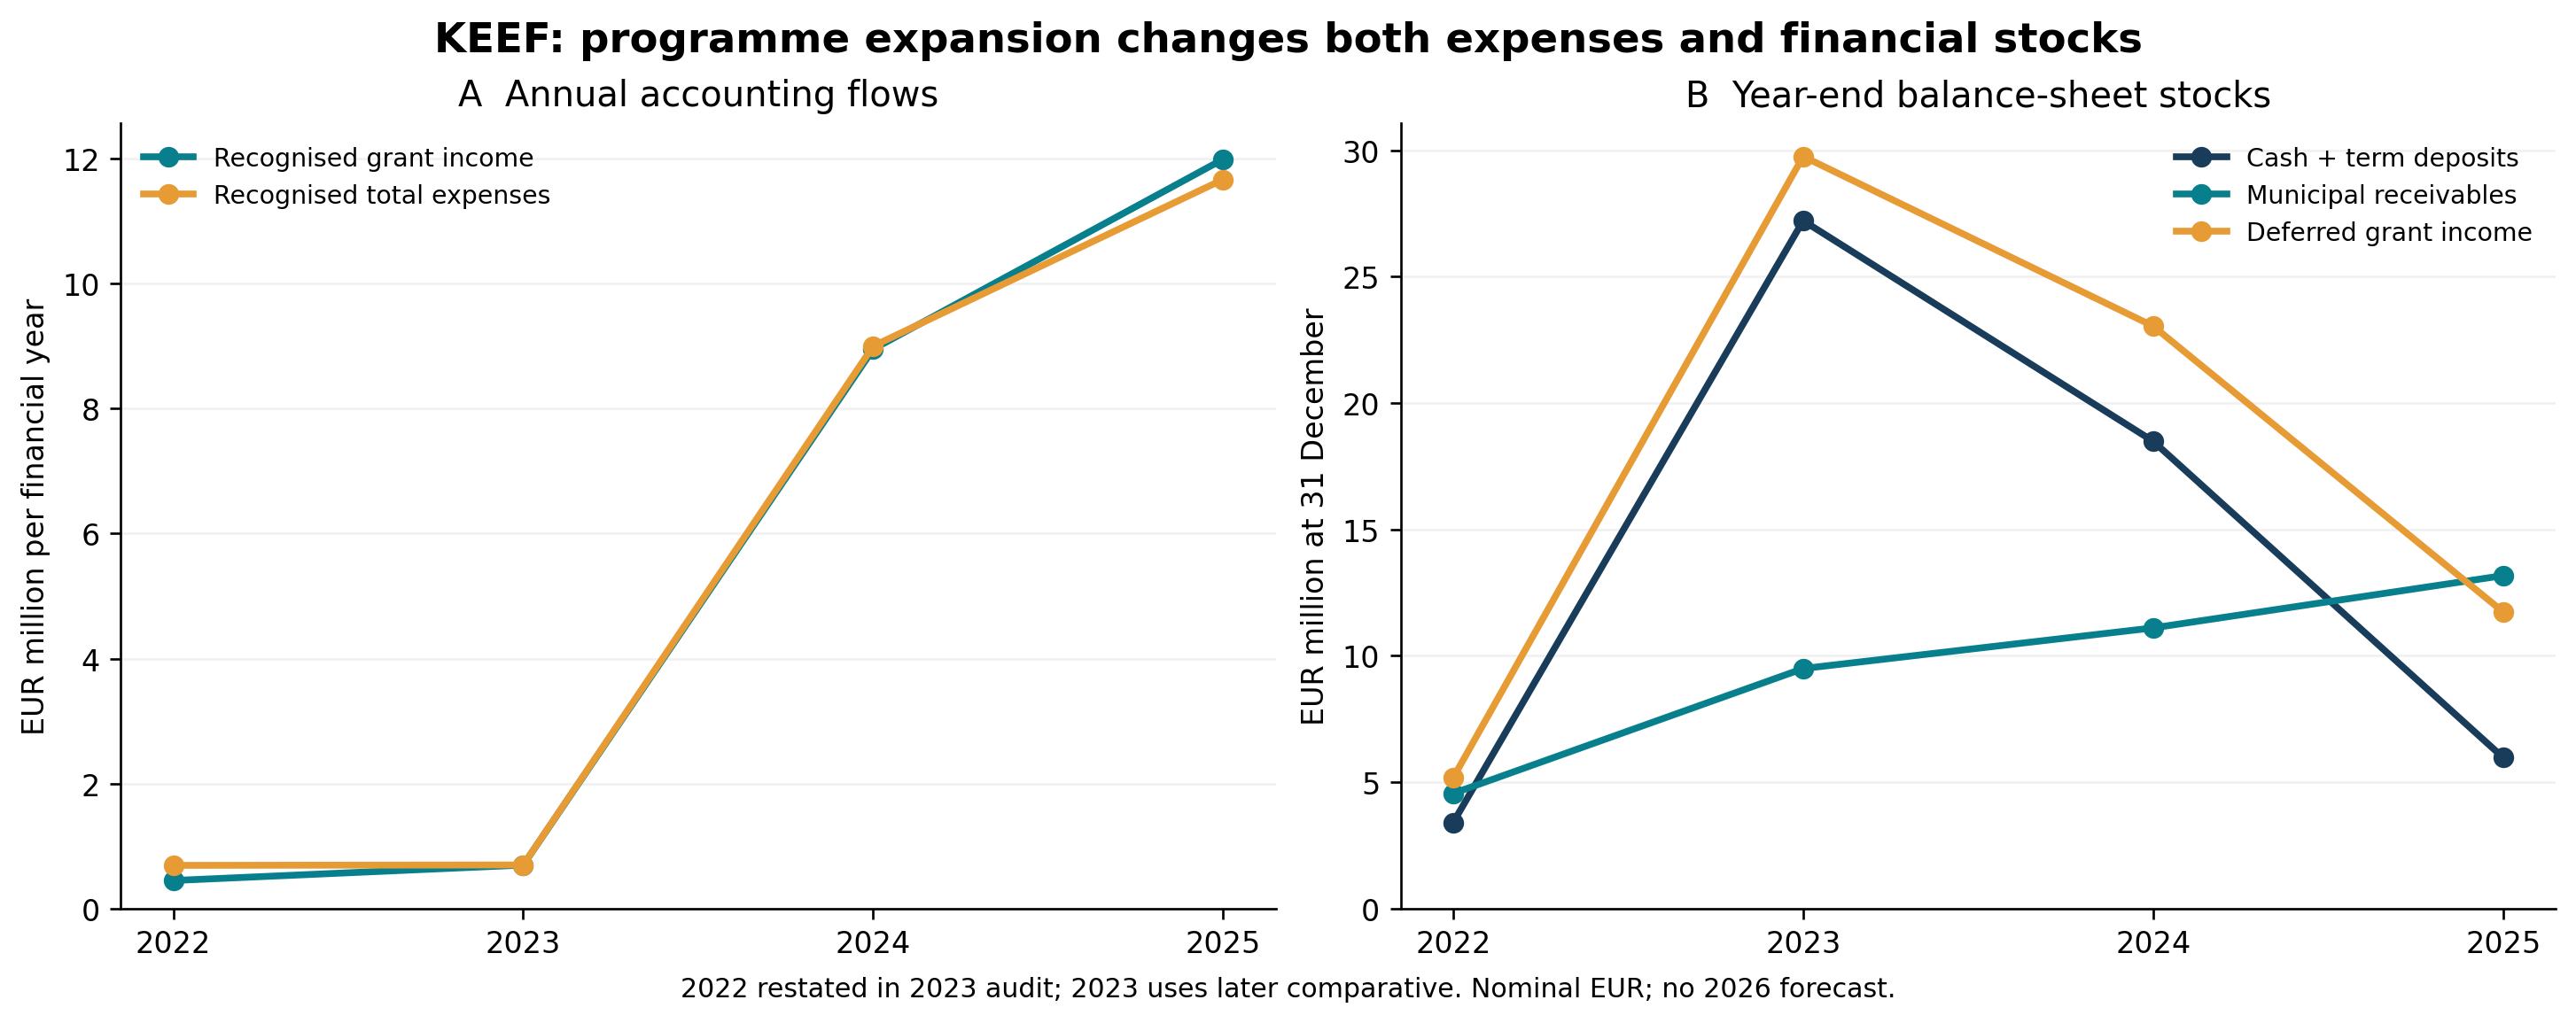
These numbers establish scale, not a direct retrofit demand. A dwelling is not the same unit as a building; vacancy is not heated floor area; and an external-wall material is not a verified structural system. The figures below therefore combine census denominators with programme and published regional evidence while keeping those boundaries explicit.
Stock and occupancy
Reported census endpoints
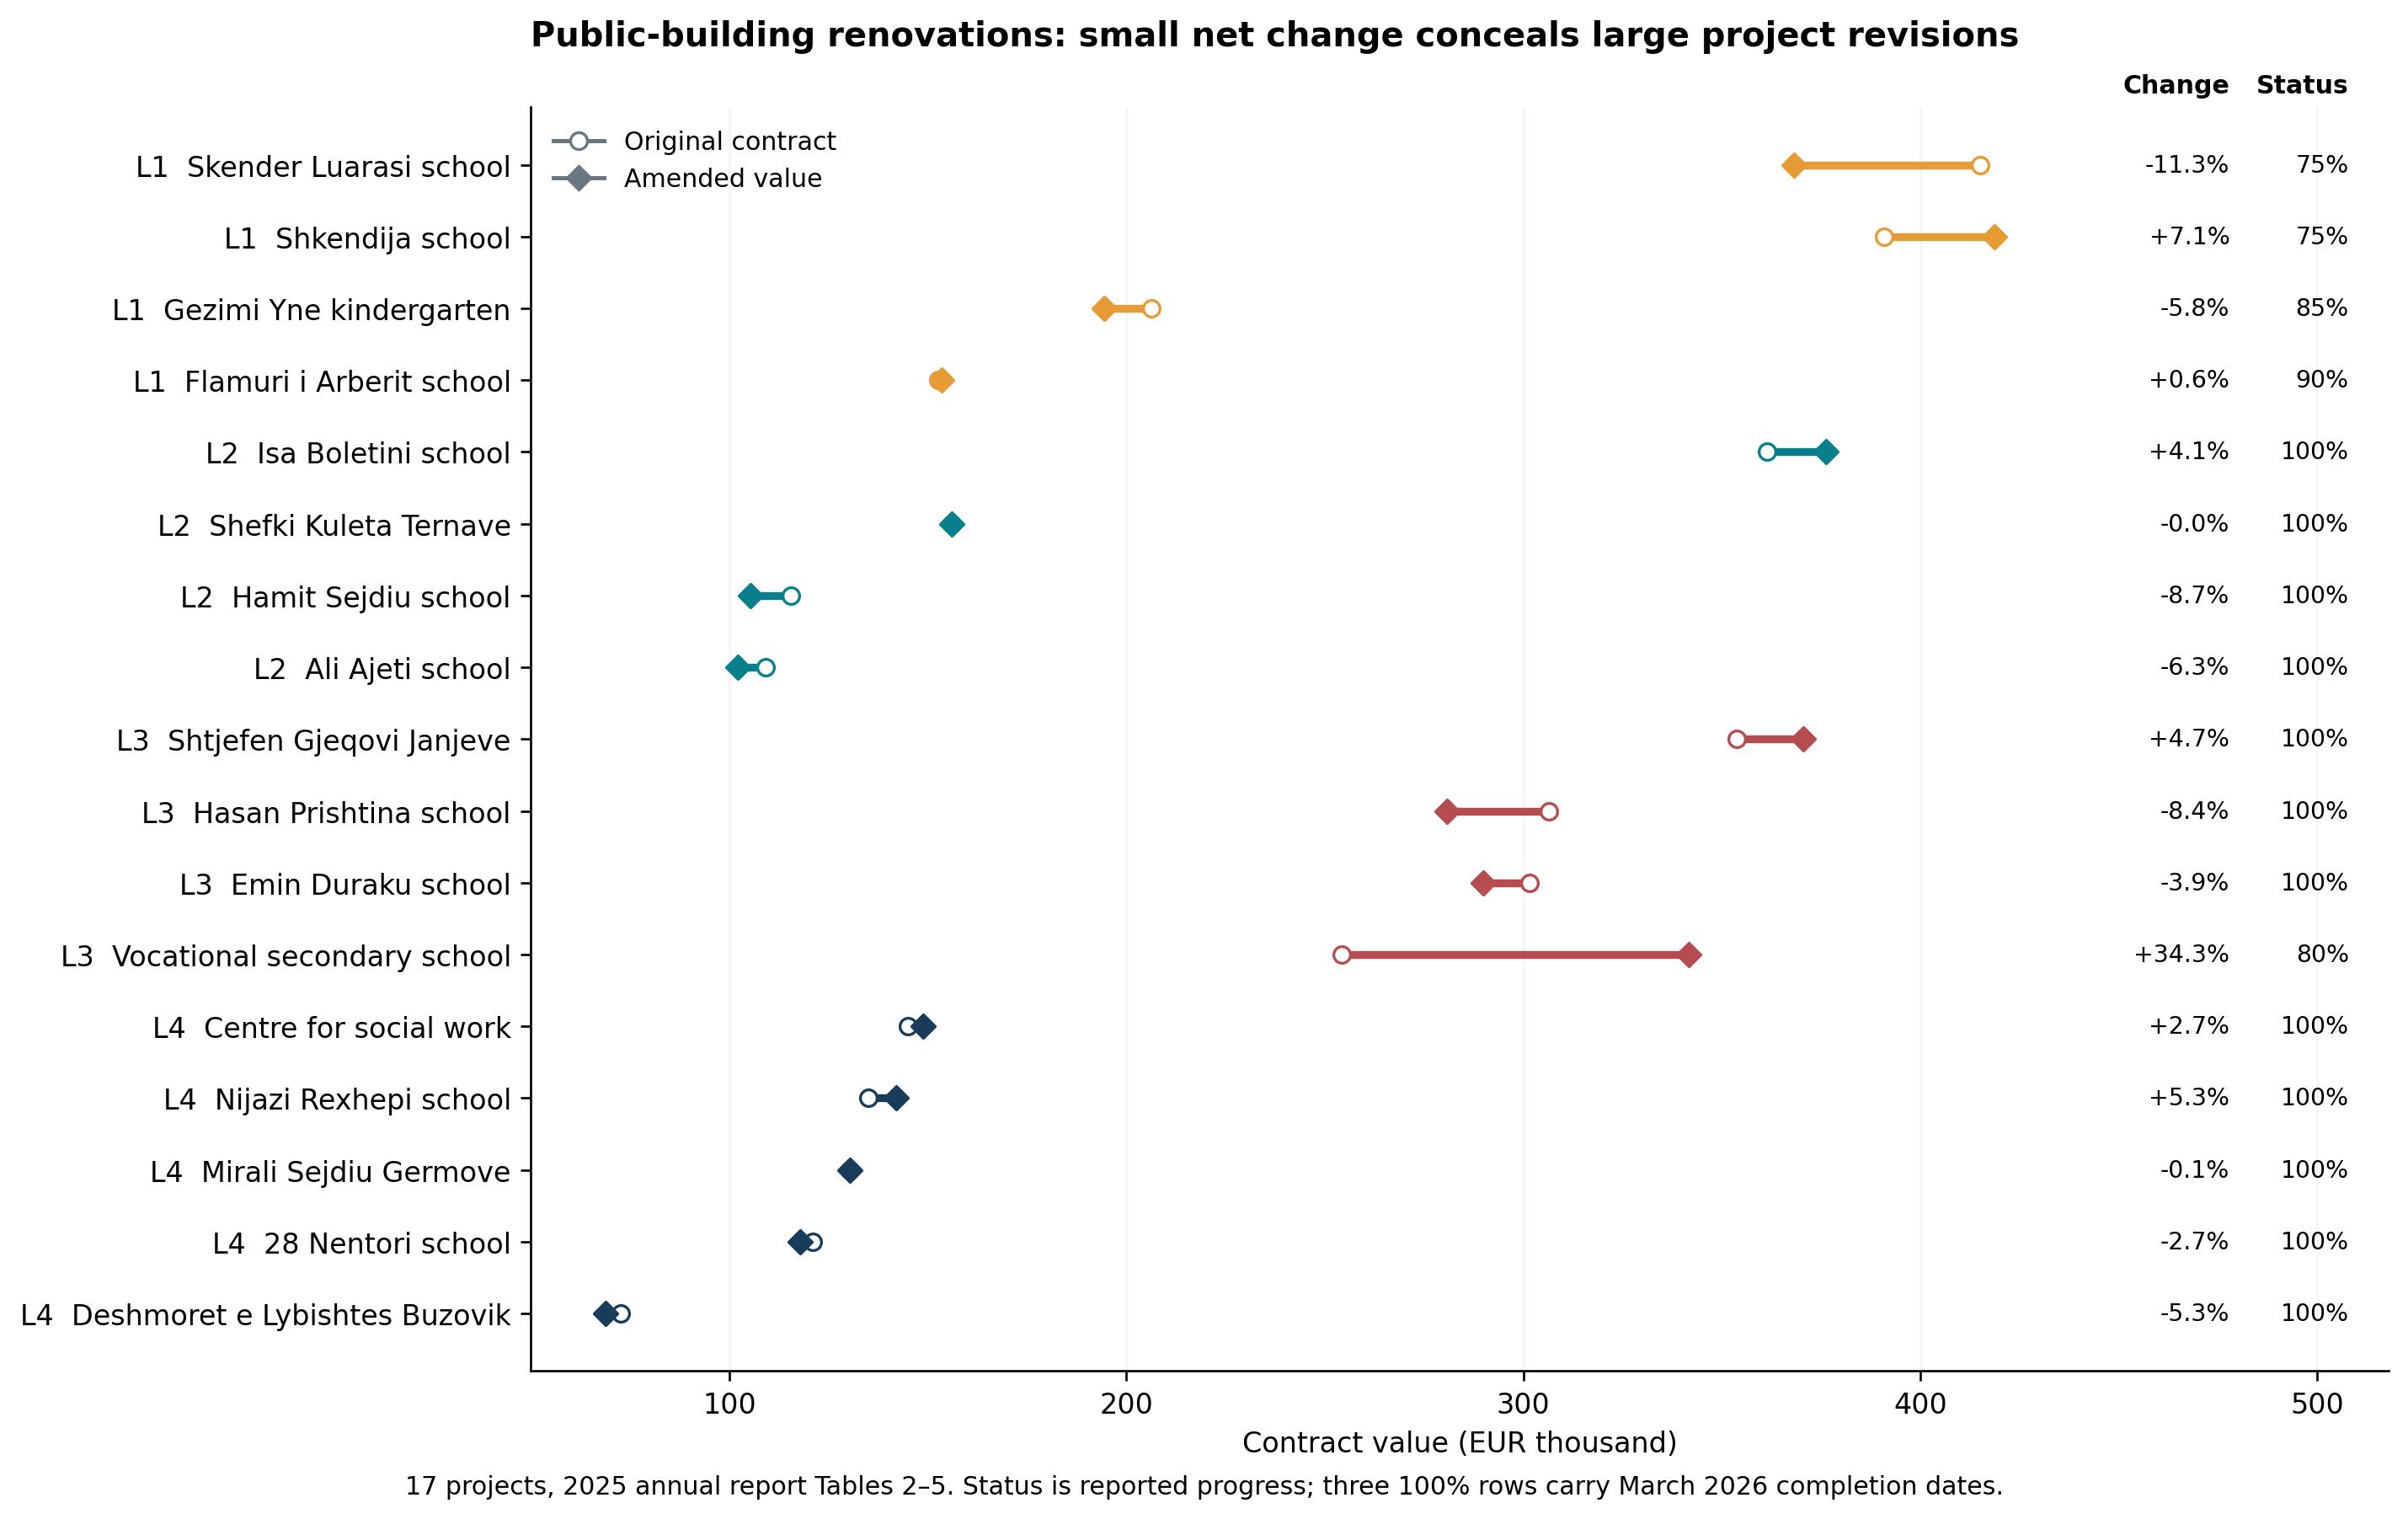
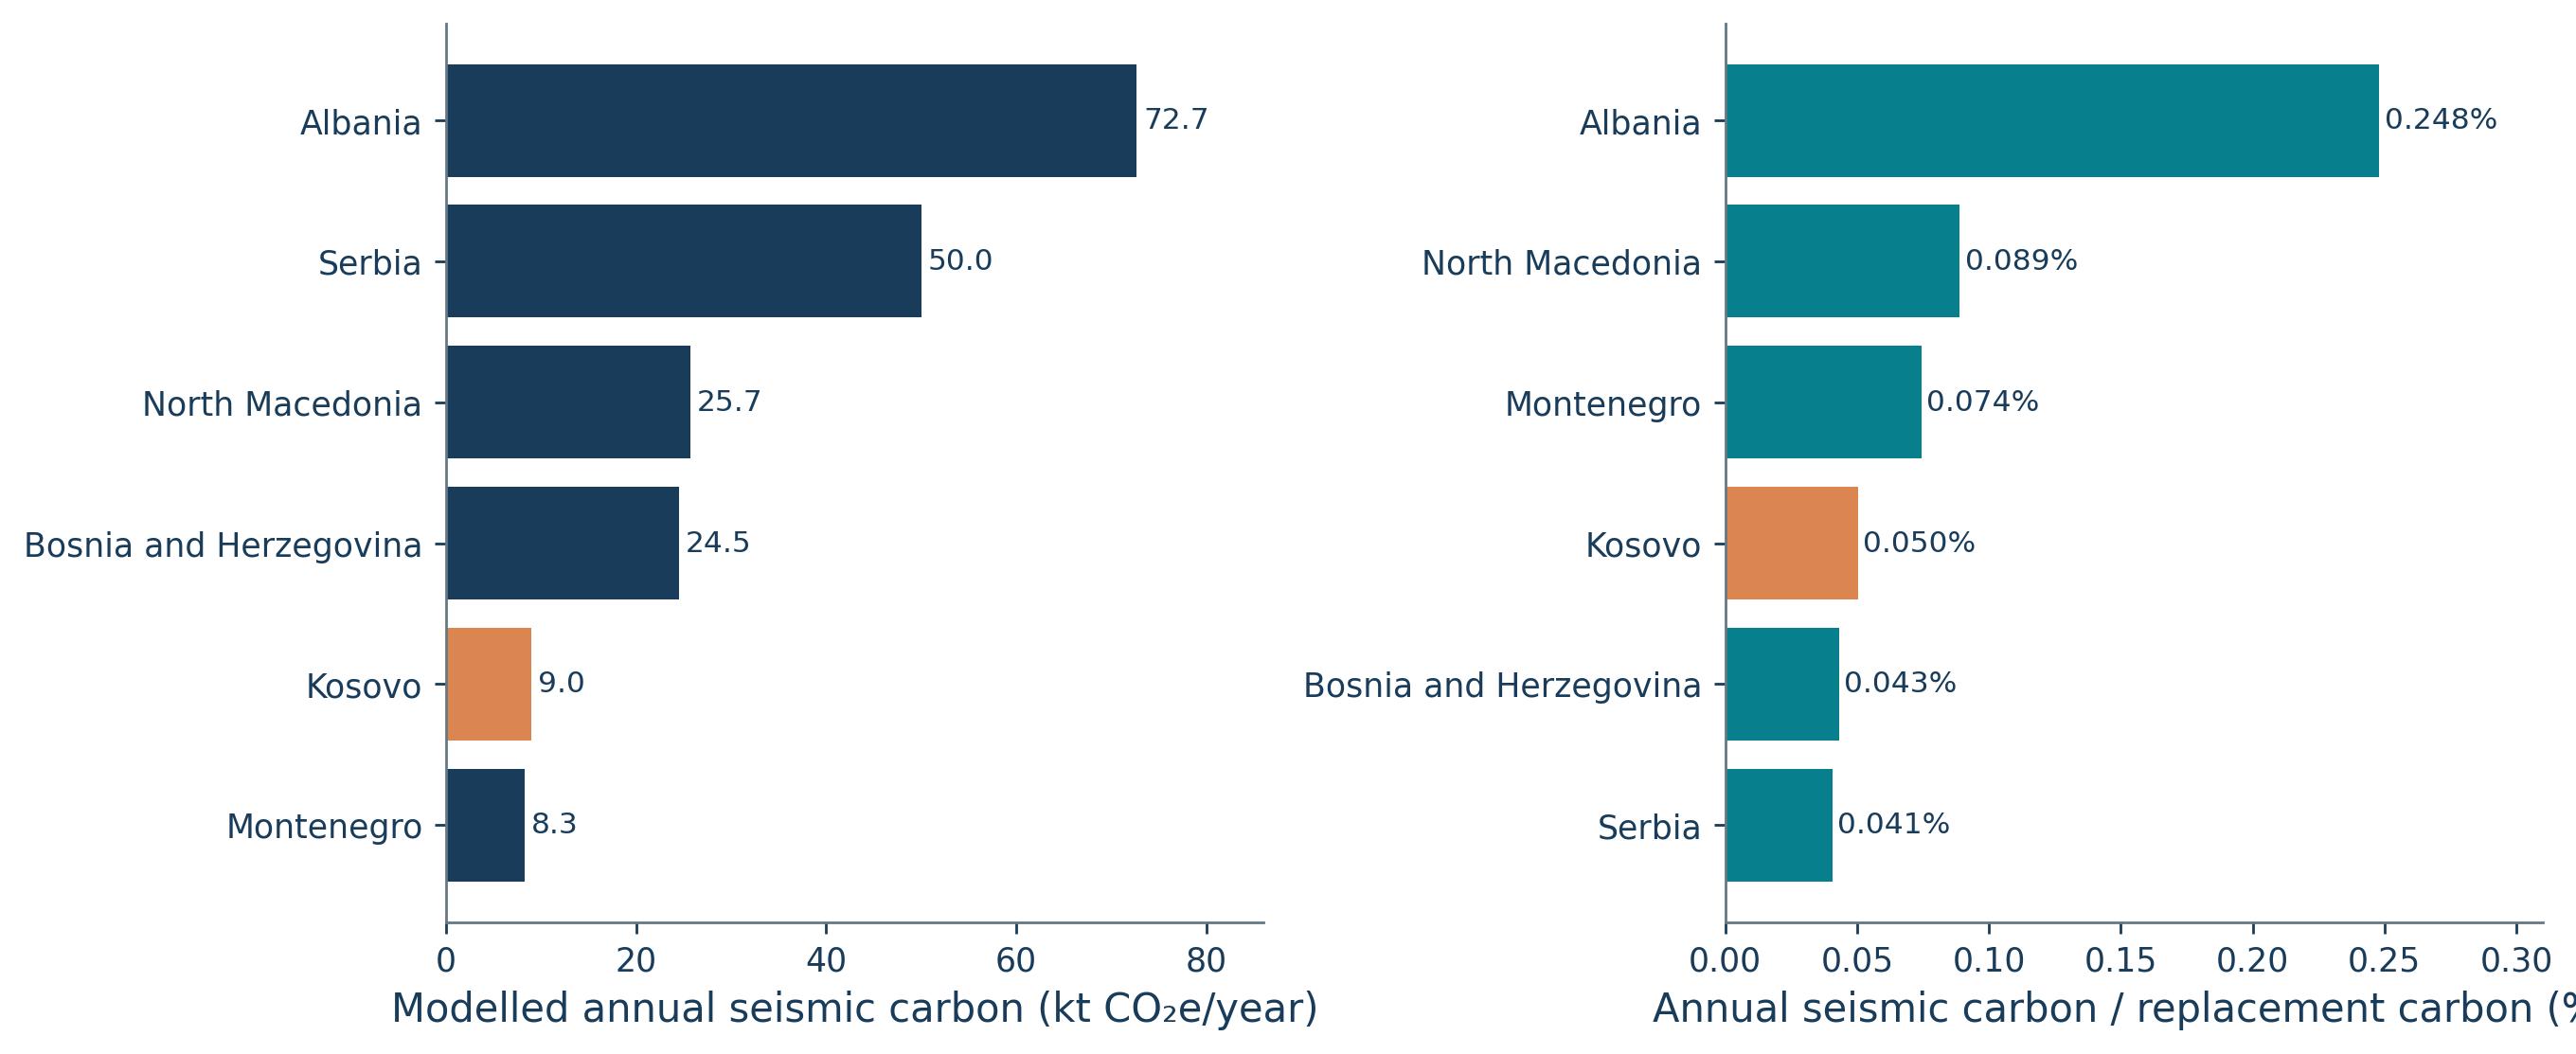
Interpretation boundary. The census, KEEF programme records, FIEC investment data and the published seismic-carbon model answer different questions. They support a coordinated case for energy renovation, occupancy-aware planning and seismic assessment, but they cannot be merged into a single retrofit rate, market share or carbon-payback estimate.
- Kosovo Agency of Statistics, 2011 and 2024 census housing endpoints and the July 2025 housing release.
- Kosovo Energy Efficiency Fund audited statements, annual reports and public-project records, reviewed to 22 October 2026.
- Caruso et al. (2026), published Western Balkans seismic-carbon model, Table 2.
- European comparison: FIEC 2025 country reports already documented in this article. Values unavailable on an equivalent basis remain “n/a”.
03 · JRC / SBV figure
Existing vs new structures,
Switzerland 1980–2007
The longer Swiss series shows the gradual rise of work on existing structures—from about one fifth of construction activity in 1980 to almost two fifths by 2007.
The change was not linear. The existing-structures share climbed through the 1980s and early 1990s, reached a chart-read peak of 41.5% in 1998, and then settled around 38–40% during much of the following decade. The stacked chart keeps the complementary new-structures share visible at every year.
This is Swiss—not European—data. The source attributes the figure to JRC Figure 1.1, which cites the Swiss builders’ association (SBV), Zahlen und Fakten 2008. Values were read from the published bars and carry an approximate uncertainty of ±0.5 percentage points.
The Swiss share of work on existing structures and the FIEC housing-renovation investment share use different definitions and denominators. They provide complementary context but must not be combined into one time series.
Share of work on existing and new structures
Switzerland, 1980–2007 · 100% stacked bars
Digitised values and provenance
Every year remains linked to its supplied source and verification status.
| Year | Existing structures | New structures | Status | Source | Accuracy / note |
|---|
04 · audit trail
Every value,
with its source
Filter the complete extraction by country, segment, type, source file or status. Empty source cells are shown as “n/a”, not zero.
| Country | Segment / row | Year | Value type | Value | Status | Source table / figure | Source file | Page | Quality note |
|---|